By now, we all know that page speed is crucial for both SEO and user experience.
Page loads fast = Happy users + Higher Ranking
Page loads slowly = Higher bounce rates + Lower Ranking
But measuring by yourself is not enough – You might be using a different browser, that page may be cached, you have better hardware, or you are located closer to the server. So, our goal is to try and measure how other users experience the website.
If you already use Google Analytics, Goal Tracker can help you track how long pages take to load, which will help you prioritize and optimize pages.
Setting up Page Speed Tracking in Goal Tracker for Google Analytics #
With Goal Tracker, setting up Page Load Time is easy. In the plugin’s settings tab, under Custom Event Tracking, enable the Page Speed Tracking feature. Then click Save.
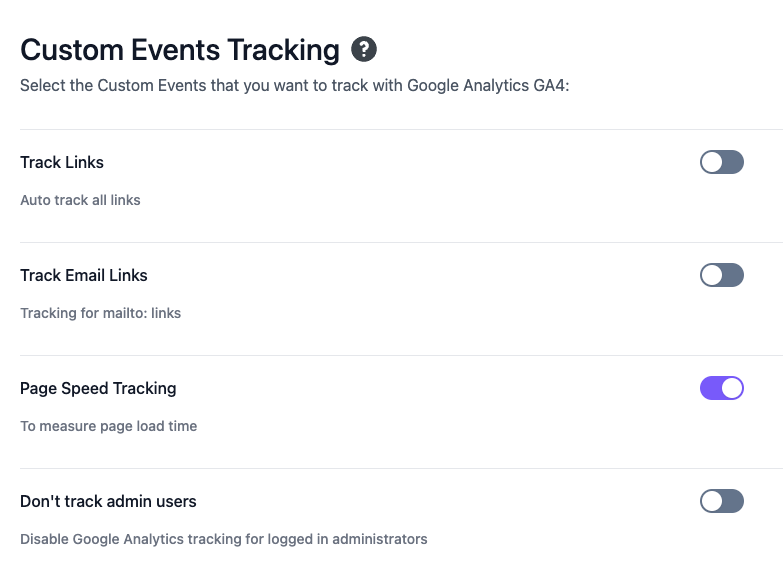
From then on, the plugin will send out a “page_load_time” event whenever someone visits a page.
The event will include the “page_load_time” metric, which you can later use to learn how fast each page loads.
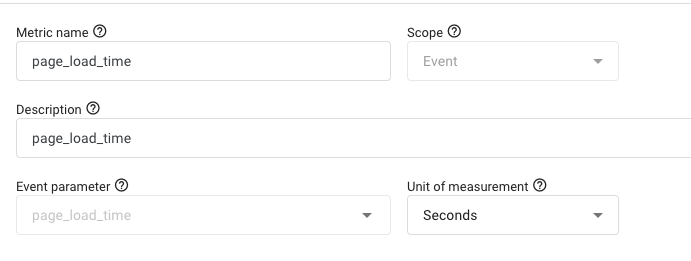
Creating the page_load_time custom metric in Google Analytics #
Ok, so this step is important.
Once you enable the feature in Goal Tracker, you will have to go to Google Analytics and create a Custom Metric.
Why? Because without it, you will not be able to query the page_load_time metric. It also tells Google Analytics which type of data it contains.
- Open the Google Analytics dashboard and go to the “Admin” section.
- Then, under “Data display”, click “
 Custom definitions”.
 - Select Custom Metrics and then click on the Create Custom Metric button.
- For “Metric Name”, enter “page_load_time”.
- For “Event Parameter”, enter “page_load_time”.
- And set the “Unit of measurement” to Seconds.
It should look like this:
How to view the Page Speed performance in Google Analytics #
This title is a bit deceiving because Google Analytics is a great tool, but sometimes it can be quite infuriating.
You see, there’s no good way to create a page speed report where we show the average page load time.
For that, we need to use a different free tool from Google called Looker Studio.
But don’t worry, it’s really simple and will only take a few minutes:
- Log in to the Looker Studio.
- Create a Blank Report.
- Now it’s going to ask you to connect a data source. Select Google Analytics under Google Connectors.
- Select your Google Analytics account and click Add.
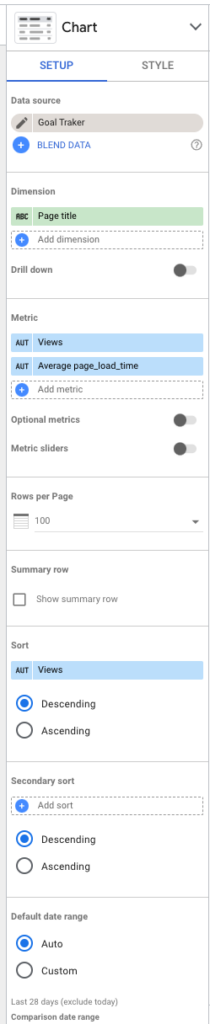
- In the Chart Setup column, click “Add dimension” and select “Page Title”.
- Remove the Event Name dimension (there’s a little x button when you hover over it).
- In the Chart Setup column, click “Add metric” and select “Average page_load_time”.
- Remove the Views metric (there’s a little x button when you hover over it).
The Chart Setup column should look like this:
And once configured, you should be able to see a similar report:

This report can give you a good idea as to which pages require optimization and which are performing well.


